|
Passive Crossovers
Previously on this site, high-pass and low-pass crossovers were briefly covered. This page will go more in-depth. It will cover 1st-4th order crossovers and their characteristics. It will also cover various RC, RL and RLC networks that are used to tame peaks/dips in frequency response and impedance.
High Pass Crossovers
Below there are 4 different crossover configurations. The graph in the middle of the 4 systems shows the slopes for 6dB (first order), 12dB (second order), 18dB (third order) and 24dB (fourth order) per octave crossovers. The crossover components' colors match its corresponding curve on the graph.
 In this crossover, the capacitor blocks the lower frequencies while allowing the higher frequencies to pass.
 In this crossover, the capacitor does the same thing as in the previous diagram. The inductor shunts, to ground, some of the low frequencies that are allowed to pass through the capacitor. This causes a higher roll off rate.
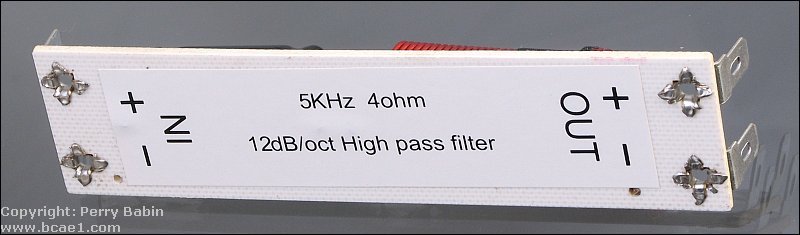
The following is one example of a second order high-pass crossover.
 Same as above, steeper slope.
 See above.
Low Pass Crossovers
Below there are 4 different crossover configurations. The graph in the middle of the 4 systems shows the slopes for 6dB (first order), 12dB (second order), 18dB (third order) and 24dB (fourth order) per octave crossovers. The crossover components' colors match its corresponding curve on the graph.
 In this crossover, the inductor (coil) blocks the higher frequencies while allowing the lower frequencies to pass.
 In this crossover, the inductor does the same thing as in the previous diagram. The capacitor shunts, to ground, some of the higher frequencies that are allowed to pass through the inductor. This causes a higher roll off rate.
 Same as above, steeper slope.
 See above.
You can see that the higher order crossovers are more complex and harder to build but they also provide a steeper slope. It is not necessary to use a high order crossover to have a great sounding speaker system. Every system has unique requirements to achieve the best sound quality. The installer must determine which type will work best (that's why they get the big bucks :-).
Comparing Different Filter Types
The previous calculator determines the values for a 2nd order (12dB/octave slope) Linkwitz-Riley crossover. This type of crossover is very common because of it's flat response when the high and low frequency power outputs are summed. This is important to prevent a dip or peak in the acoustic power response of the speakers (it provides a flat frequency response at the crossover point when driving both high and low frequency drivers).
-
Basics:
-
When you double the cone area (add a second speaker with equal properties) while keeping the power constant, you gain 3dB of output. If you reduce the number of speakers by 1/2, you lose 3dB.
-
If you double the power to a driver, you gain 3dB. If you cut the power by 1/2 you lose 3dB.
-
If you double the cone area and the power (by paralleling the second speaker on the amplifier), you gain 6dB.
-
The 'Q' of a filter (crossover) indicates the shape of the curve. For a second order crossover, it can be calculated with the formula: Q=[(R2C)/L]1/2
Where R is the speaker's impedance. C is the capacitor used in the filter. And L is the inductor used in the filter.
|
Chebychev:
|
Q = 1
|
|
Butterworth:
|
Q = .707
|
|
Bessel:
|
Q = .58
|
|
Linkwitz-Riley:
|
Q = .49
|

|
|
|
|
-
Notes:
-
The Green slope above is the same slope you get with a first order Butterworth alignment.
-
This section does not deal with phase response or group delay. Both are important when building high quality crossovers. If you were building a pair of home speakers, phase and delay would be important but a car audio environment has so many problems (speakers not equidistant from all listeners, multiple drivers reproducing the same signal...) that I don't think it would be of use to enough people to cover it here.
2nd order Linkwitz-Riley:
In the following graph, you can see the response for both the high and low frequency drivers. You can also see that the crossover point is 150hz. As previously noted, the on-axis acoustic output of a L-R crossover has a flat response at the crossover frequency. To do this, the crossover point has to be 6 dB down. Since there are 2 drivers (a midrange and a woofer) operating at the crossover point and they presumably have a comparable output and they are receiving the same power (both 6dB down from full power), the output (their summed on-axis acoustic output) will be as if a single driver were playing at the crossover point. This will provide a flat overall frequency response at the crossover point.
Note:
In this section, you will see that there are red and yellow curves (in-phase and reverse-phase curves). If the speakers are wired with the same polarity (the positive speaker wire connected to the positive terminal of each speaker) the connection is in-phase. For 12dB/octave crossovers, this connection will result in a deep dip in the output response at the crossover point. To get a flat response (or close to flat for alignments other than Linkwitz-Riley), you must wire one speaker out of phase (typically, the tweeter is wired out of phase).
| Crossover Type |
Capacitor |
Inductor |
Second Order
Linkwitz-Riley |
133 microfarad |
8.5 millihenry |
 |
|
2nd order Bessel:
On the next graph, you'll see the response of a 2nd order Bessel crossover. You can see that the crossover point is 5dB down from the pass band. The summed response will give you a slight peak at the crossover point. The high pass and low pass curves have a Q of 0.58.
Crossover Type
|
Capacitor |
Inductor |
Second Order
Bessel |
152 microfarad |
7.4 millihenry |
|
|
2nd order Butterworth:
On the next graph, you'll see the response of a 2nd order Butterworth crossover. The crossover point is 3dB down from the pass band. The summed response will give you a 3dB peak at the crossover point. The high pass and low pass curves have a Q of 0.707.
Crossover Type
|
Capacitor |
Inductor |
Second Order
Butterworth |
188 microfarad |
6.0 millihenry |
|
|
2nd order Chebychev:
On the next graph, you'll see the response of a 2nd order Chebychev crossover. The crossover point is at the same level as the pass band. The summed response will give you a 6dB peak at the crossover point. The high pass and low pass curves have a Q of 1.0.
Crossover Type
|
Capacitor |
Inductor |
Second Order
Chebychev |
265 microfarad |
4.2 millihenry |
|
|
Open Crossover Output Warning
You may damage your amplifier if you drive a second (or higher) order crossover when the speaker's voice coil is open (the speaker is blown) or if no speaker is connected to the crossover's output. When the speaker is removed (or the voice coil opens), the circuit becomes a resonant circuit. This circuit will, at the crossover frequency (or some multiple of the crossover frequency), present a 0 ohm load to the amplifier. The actual resistance will be only the resistance in the speaker wire and the inductor. Any time that there is audio at the resonant frequency, the amplifier will be stressed the same as if the speaker wires were shorted together. This will drive some amplifiers into protection. Others will blow a fuse or die a horrible painful death. The following graph shows how the impedance of the normal circuit (violet line) never drops below 4 ohms (the speaker's impedance). It also shows how the impedance of the circuit without a speaker (yellow line) drops to 0 ohms at the crossover frequency (for a 2nd order crossover, the resonant frequency is the same as the crossover frequency).
Correcting Passive Crossover Problems
Note:
The frequency response plots 'with a speaker' are computer simulations. If we measured the output of an actual speaker with a microphone, the response would not be nearly as smooth. There would be many small dips and peaks.
Projected Impedance:
This graph is the projected impedance plot of an ideal 4 ohm speaker and a 12dB/octave Linkwitz-Riley crossover. This is actually how the impedance would look with a resistor but a speaker has a dynamic impedance that changes with frequency and will not be as flat. The rise in impedance at the high frequency end of the spectrum is normal and is what causes the speaker's output to roll off.
Projected Response:
This is the projected frequency response for the ideal 4 ohm driver (speaker) and a 12dB/octave Linkwitz-Riley Crossover. You can see how the roll off is nice and smooth (no bumps or dips).
Impedance plot using speaker's varying impedance:
This graph is the impedance plot for the driver and the Linkwitz-Riley crossover only. You can see the peak in impedance around 64 hertz (at the speaker's resonant frequency in its .55 ft3 enclosure) and the rising impedance above ~500hz. This rise in impedance will cause the frequency response to deviate from the projected response.
Response with Crossover and Driver:
As I said before, the rising impedance (due mostly to the voice coil's inductance) will cause the frequency response to be less than perfect. If the crossover point fell on a 'flat' part of the impedance plot, there would be no bump in the slope.
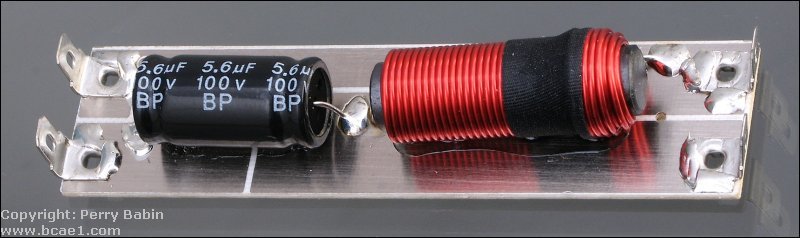
Conjugate Networks:
These networks use resistors, capacitors and inductors to correct for impedance variations in speakers. In the following diagram, you see the Linkwitz-Riley crossover components (a capacitor and an inductor). You can also see a few other networks (marked 'A', 'B' and 'C').
Impedance Correction Network:
This type of network (marked 'A' in previous diagram) is also called a Zobel network. It uses a resistor and a capacitor to counteract the effect of the voice coil's inductance and allow the crossover to follow the proper slope. In the following graph you can see a smoother impedance curve near the crossover frequency. This is due to the RC (resistor/capacitor) network.
And here you can see the smoother slope:
Other Problems:
For most systems, the following crossover and single conjugate network would be enough. Some situations require more extensive impedance compensation.
In the previous impedance plots, you should have noticed the rising impedance above ~5000hz. Some amplifiers may have trouble with this type of reactive load. To correct it, you can use another RC network to simulate a more resistive load. In the following impedance plot, network 'B' is employed. You can see how the impedance at the high frequency end of the plot is now almost flat.
On the following graph, you can see that it had virtually no effect on the frequency response while it flattened the impedance.
Reducing Resonant Peak:
If you're using an amplifier with a low damping factor (this would generally be tube amplifiers), the impedance rise at resonance may cause audible frequency response anomalies. If we use the RLC network, we can flatten the impedance of the system (as seen in the following diagram). The inductor and capacitor create a resonant bandpass filter and the resistor limits the current through the filter. Without the resistor, the impedance would drop to 0 ohms.
And again we can see that we fixed the problem without effecting the frequency response.
|